TVO Market Barometer 7-20: Is it just a pullback or much more?
Last week the bulls finally got their SPY 280 (and then some), but before the dust had the chance to settle, markets seemed to lose steam. Is it just a pullback or a sign of more bearishness to come?
Well, from a technical standpoint, it’s probably safe to say that the SPY head and shoulders folks have left the building (as well as the double top crowd, unless of course you look at the chart with your head tilted sideways). And someone might want to inform the shorts that a retest of a prior breakout level is quite a normal and healthy occurrence, and that it’s the extreme, seemingly non-stop breakouts that are the most prone to failure.
But I digress.
We may enjoy looking at charts here, but it’s volume alone that shapes our trading decisions. We like volume because no matter how you tilt your head to look at it, it is what it is. Volume tells you exactly what the big institutions are doing and once their decisions are made, you definitely don’t want to be on the wrong side of the game plan.
Right now in the long-term, the big volume picture hasn’t really changed since last Monday when we noticed a shift towards more accumulation. Overall volume fell in Friday’s session (on Op-ex, which is not exactly a day famous for low volume), so the apparent pullback is looking more like consolidation in disguise. -MD
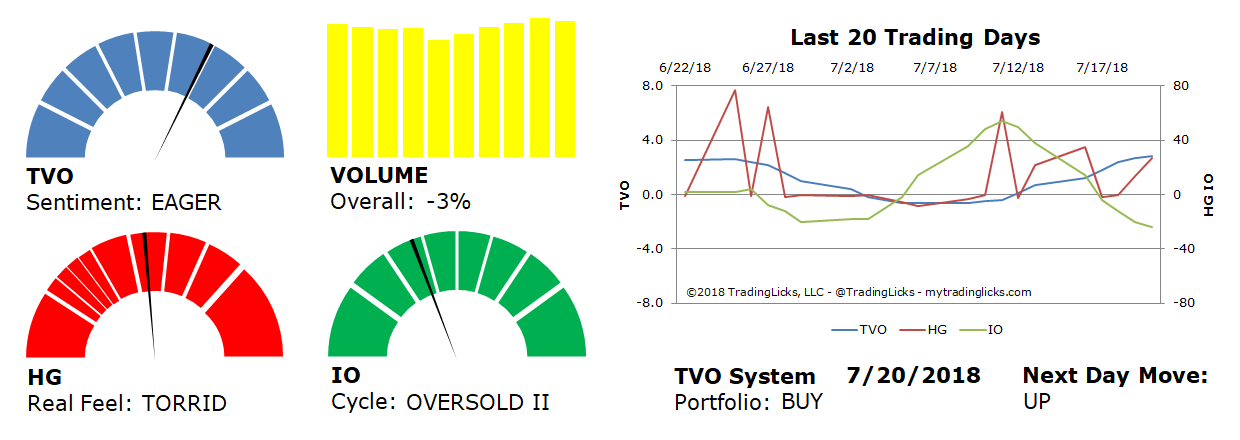
Sentiment: EAGER – Markets are in accumulation mode and big institutions are buying at a slow and steady pace.
Volume: -3% – Today’s volume was lower than the previous session.
Real Feel: TORRID – Bears were in control of the session with moderate buying under the surface.
Cycle: OVERSOLD II – Retail investors are dumbfounded and are rapidly exiting their holdings.
Portfolio: BUY – The market is healthy and it’s a good time to contribute to long-term investments.
Next Day Move: UP -Â The probability that SPY will close positive in the next session is 59%.
Want to read more? Join our list. It's free.
For the full rundown on today's active signals and options trades, please log in. Not a Member? Join us today.
To view past positions check out our Trade History.
To find out what the indicators mean, visit our Market Volume Volume Barometer.
To learn more about market volume and how we trade, find us on Twitter (@TradingLicks) and StockTwits!
The indicator descriptions in the above graphic represent general market sentiment. The actual TVO System signals and trades are listed below in the Members Area. To view, please Login. Not a Member? Join us.